Tufte.
Generate clean Tufte-style ASCII charts from CSV data. Create bar, line, sparkline & scatter plots in plain text for READMEs, terminals, and LLM outputs.
More About Tufte
Tufte
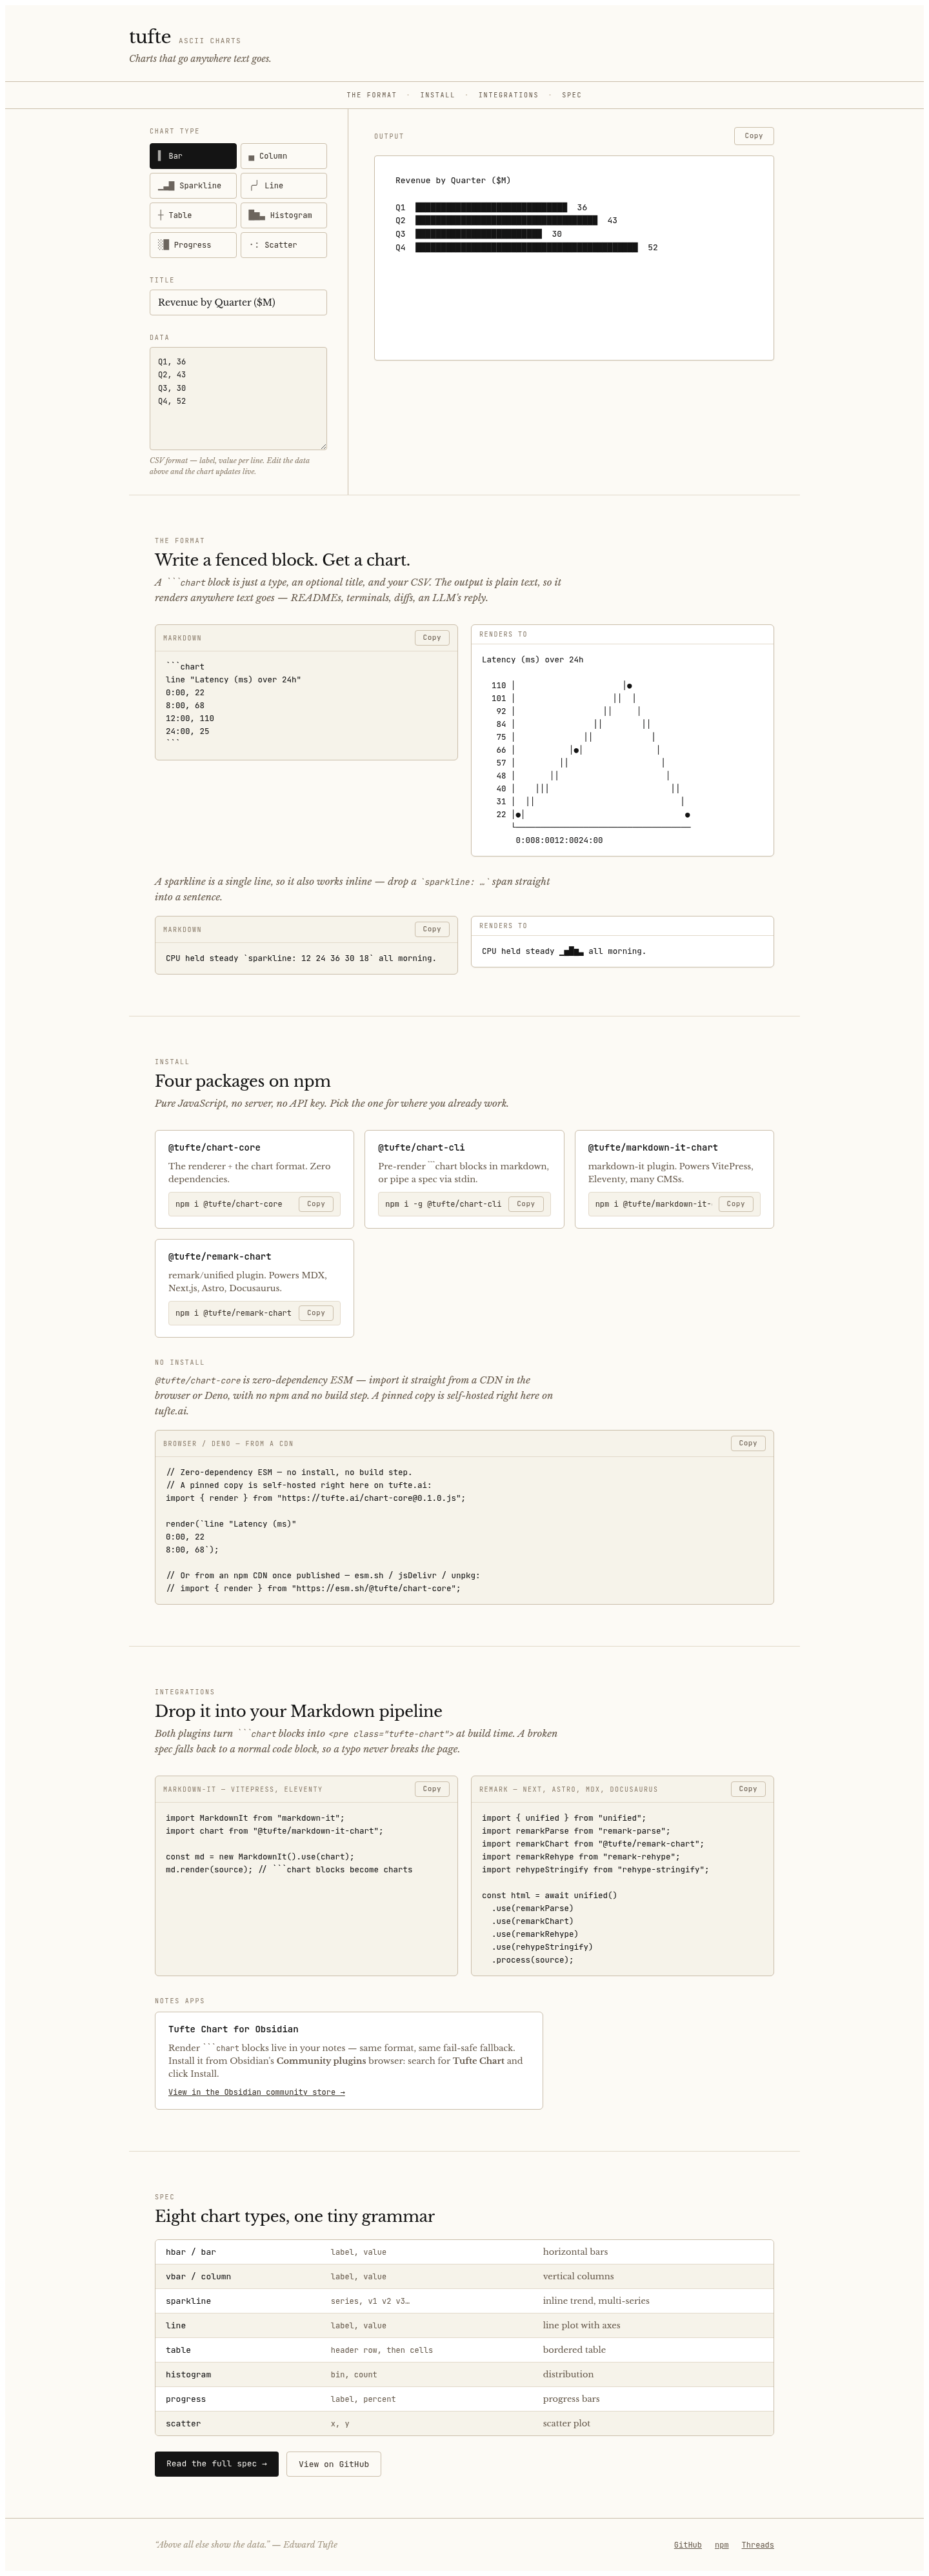
Tufte is a lightweight ASCII charting library that transforms simple CSV data into elegant text-based visualizations. Designed for developers, technical writers, and data enthusiasts, it renders charts anywhere text travels — from GitHub READMEs and terminal outputs to LLM responses and documentation sites. No images, no dependencies, no broken embeds — just pure text that works everywhere.
Product Highlights
- Universal Rendering: Charts display flawlessly in any environment that supports plain text, including Markdown files, terminal emulators, code diffs, and chat interfaces.
- Zero Dependencies: The core library is pure JavaScript with no external requirements, enabling direct import from CDNs or self-hosted sources without npm or build steps.
- Multiple Integrations: Native plugins for remark/unified, markdown-it, and CLI tools ensure seamless integration with Next.js, Astro, Docusaurus, VitePress, and custom pipelines.
- Eight Chart Types: Comprehensive visualization support including horizontal bars, vertical columns, sparklines, line plots, tables, histograms, progress bars, and scatter plots — all from a single, minimal grammar.
- Inline Sparklines: Embed trend data directly within sentences using simple span syntax, perfect for compact reporting and narrative-driven analytics.
Use Cases
- Technical Documentation: Embed live-updating charts in README files, API docs, and knowledge bases without worrying about image hosting or broken links.
- Developer Tooling: Pipe data through CLI tools to generate instant visualizations in terminal workflows, CI/CD logs, and monitoring dashboards.
- LLM-Generated Content: Include readable charts directly in AI assistant responses where image generation is unavailable or undesirable.
- Version-Controlled Reporting: Track visual data changes through Git diffs, enabling collaborative review and historical comparison of metric trends.
Target Audience
Tufte serves software developers, technical writers, DevOps engineers, and data journalists who need portable, maintenance-free visualizations. It is ideal for teams prioritizing documentation longevity, terminal-centric workflows, and environments where traditional image-based charts fail or require excessive overhead.
You might also like
See all alternatives →